

Debugging any PHP/WordPress Projects Using XDebug


Table of contents


No headings in the article.
In this article, we will be learning debugging for any PHP/WordPress using the XDebug tool.
Xdebug is an extension for PHP that helps to improve the PHP development experience.
If you don't want to read this long thread, then this video is for you > youtu.be/SFB_ZTOeLa4
\======== Readers keep reading ==============
First of all, we need to configure XDebug. Here we are going to configure it on VSCode.
Follow these steps to configure XDebug in VSCode:
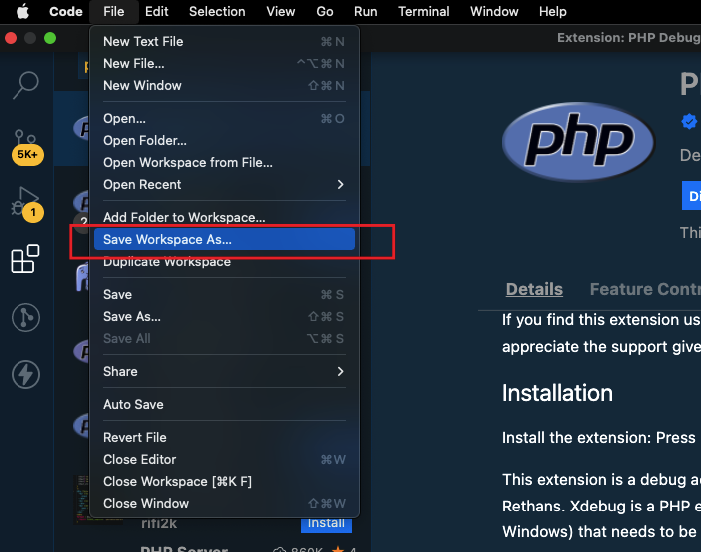
- Save your project as a workspace in VSCode and remember the name you give here. This name will be used when we configure debugger.
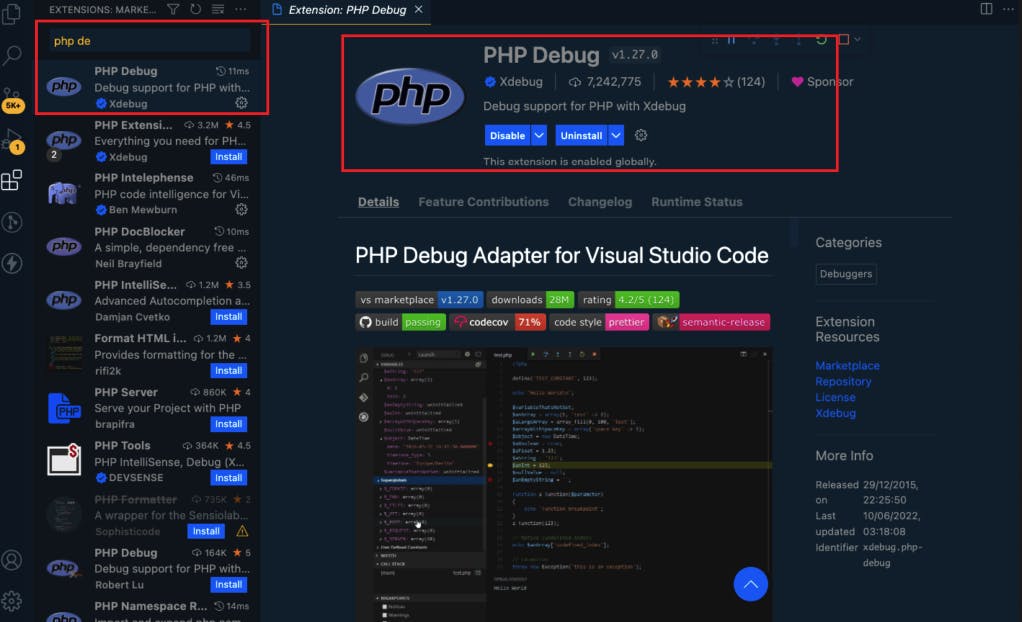
- Install PHP debugger extension in VSCode.
Now we need to Install xdebug on our system as well. Go to this link https://xdebug.org/docs/install
In this, we have given installation for different OS

Follow the steps to install based on your OS. Here we will consider we have macOS. So steps to install on your macOS is this

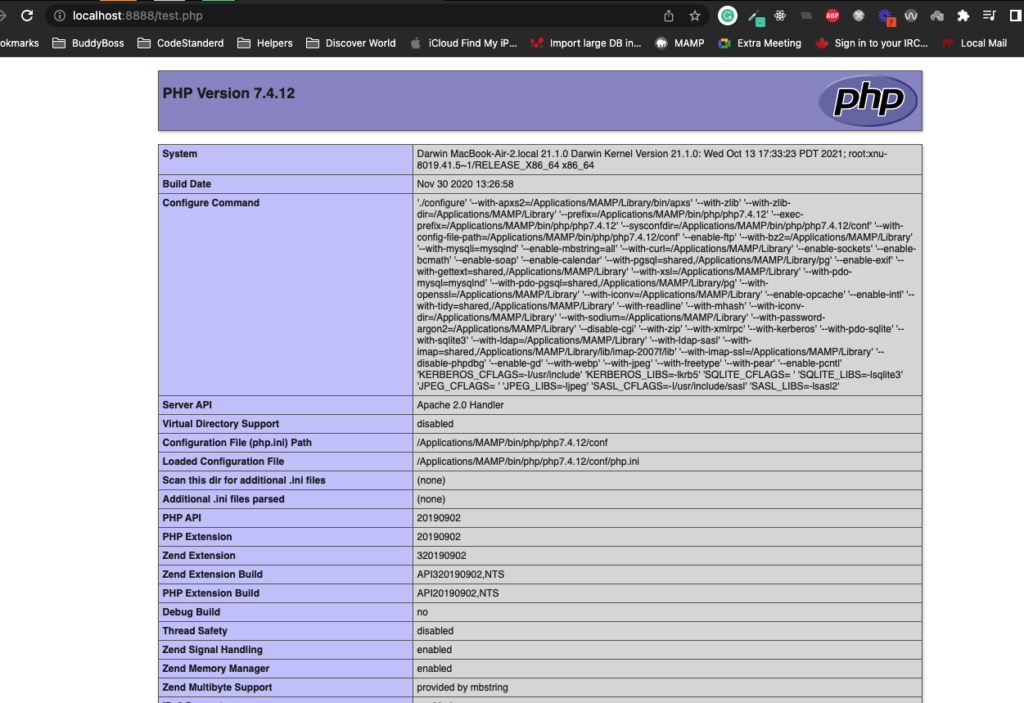
After successful installation of XDebug on your system, create a
test.phpon the root of your PHP project and addphpinfo()inside that file.Access that file in your browser. You will see your phpinfo like this
Select everything ( ctrl/cmd + a ) you see on this page and add it to xdebug wizard https://xdebug.org/wizard

Follow the xdebug wizard instructions after clicking on the `Analys my phpinfo() output` button.

After completing all xdebug wizard instructions steps, add these two lines to your
php.ini:
xdebug.client_host =localhostxdebug.client_port = 9003Restart Apache/Sevrver( MAMP, XAMP, WAMP )
Now go back to your VSCode project.
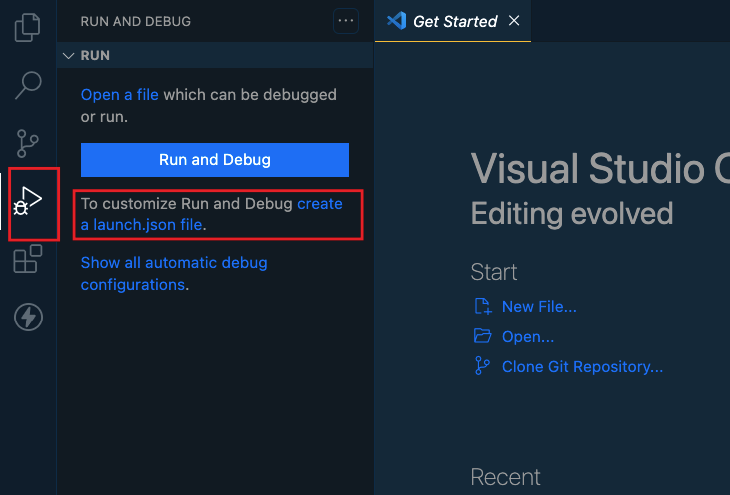
Go to debugger and create a launch.json
- Select project
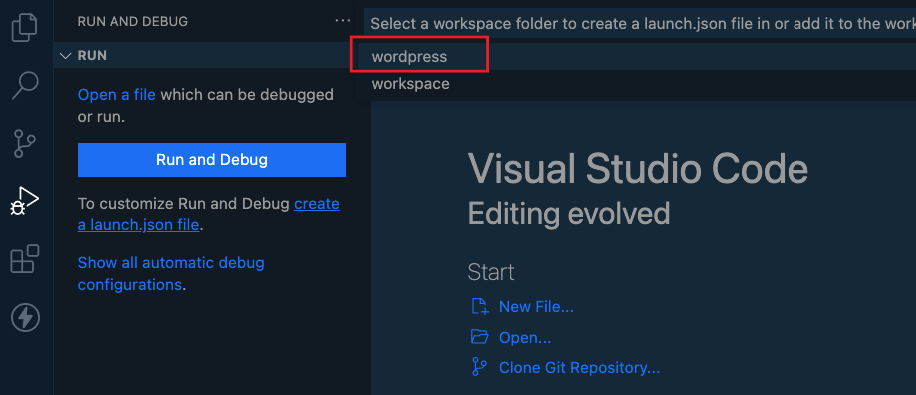
- Select PHP
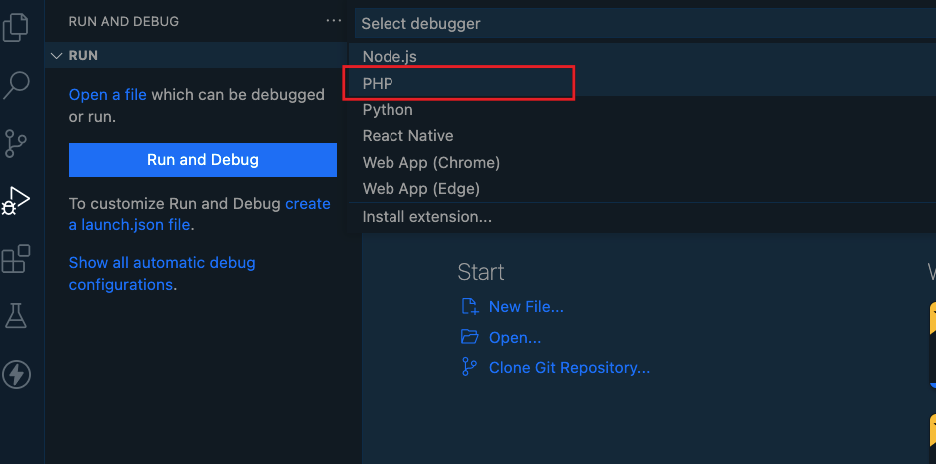
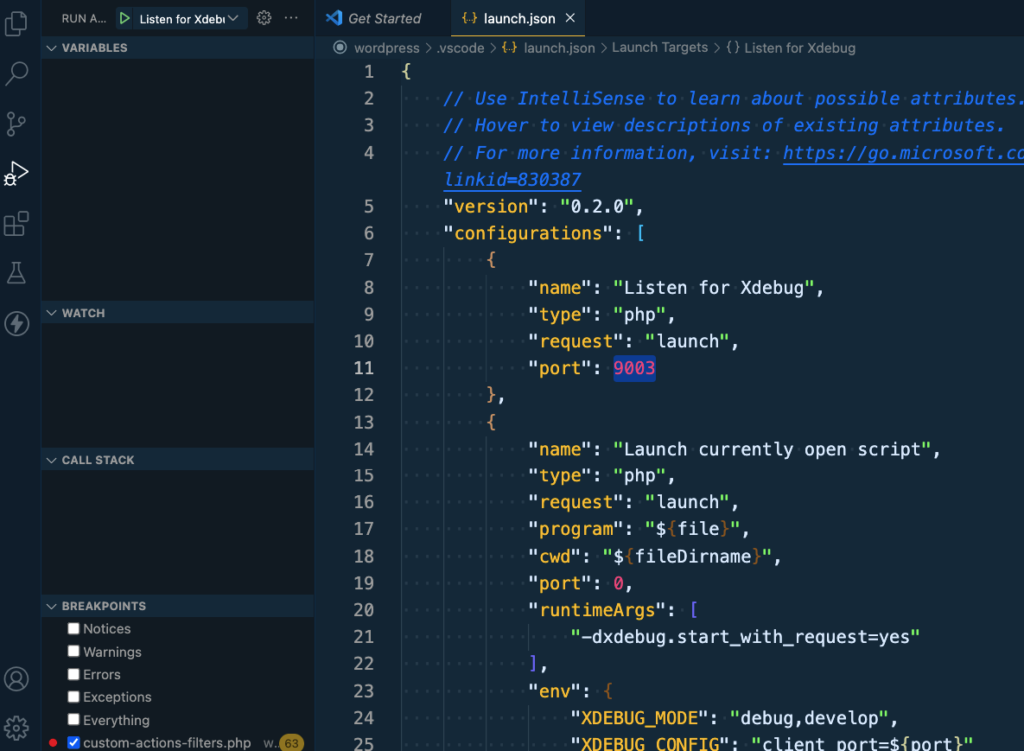
- Your json file is generated now and it will look like this
- Then click on "Listen for Xdebug" and wait for the Call Stack status `Running`.
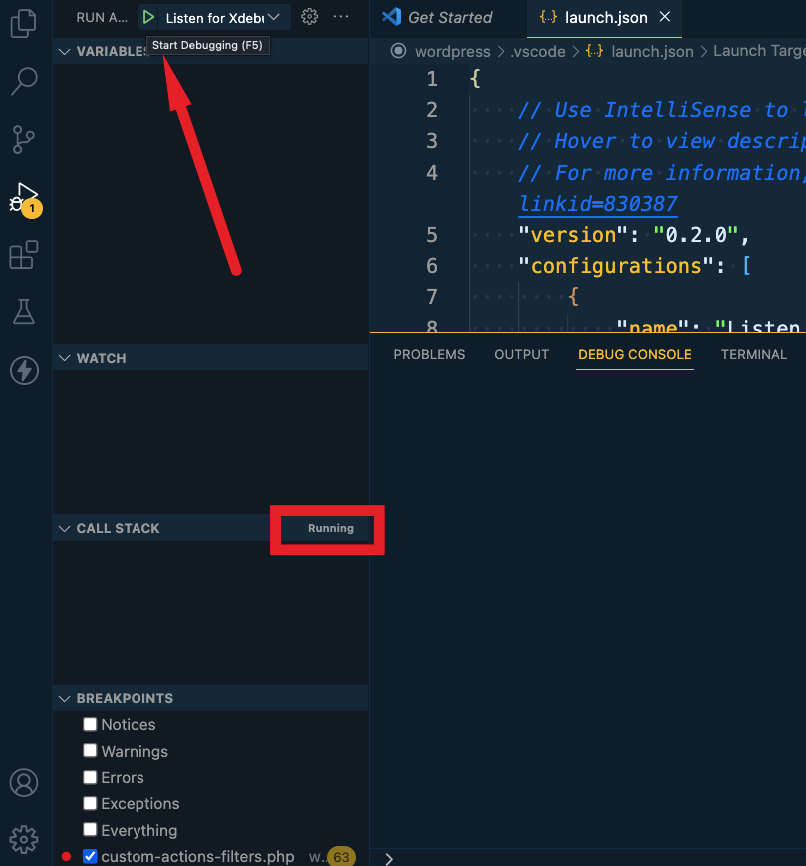
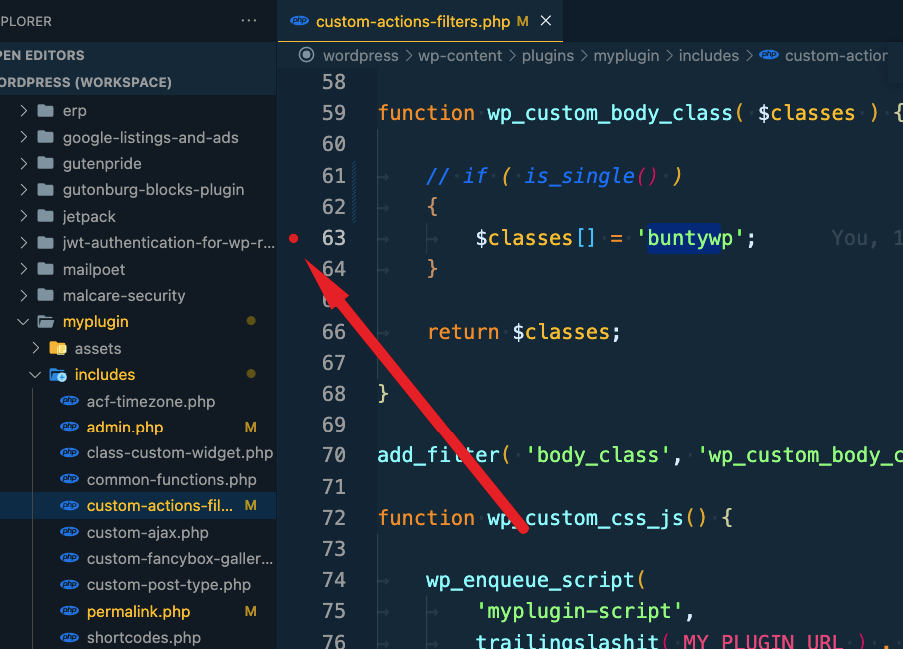
- Now it's time to add a breakpoint from where you want to start debugging. So click on the line number to set a breakpoint. You will see a red ( depends on your theme ) dot.
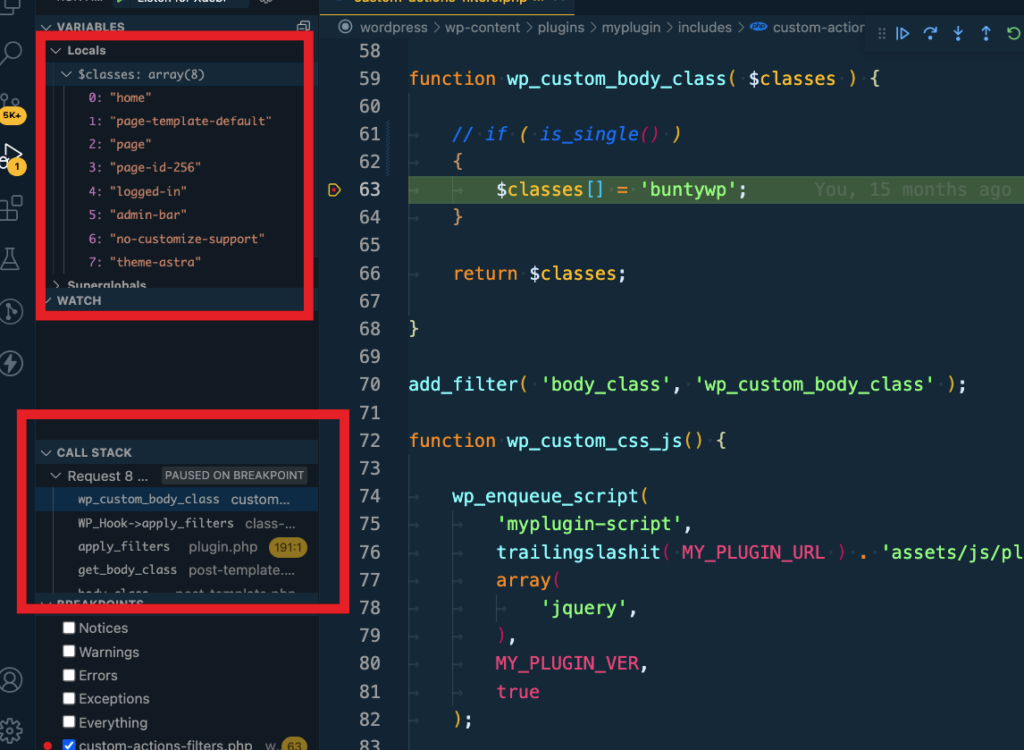
Open the site in the browser and visit the page where your code executes where you added a breakpoint.
You will see the debugging info in the debugger
That's all !!!! Enjoy Debugging !!